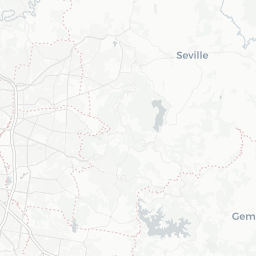
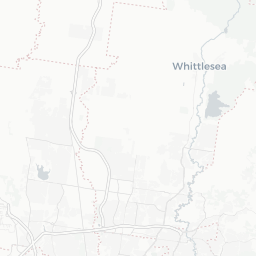
Your suburb’s tree canopy

Tree Coverage (%)
102030405060

133048162432

How does your suburb compare?

Total tree canopy coverage

Suburb
Tree Coverage (%)
Park Orchards
63.2
Warrandyte
61.7
The Basin
58.8
Wonga Park
58.2
Lysterfield
50.6
Warranwood
50.5
Upper Ferntree Gully
46.3
Warrandyte South
45.9
Donvale
45.9
Croydon North
44.3
1–10 of 258 rows
...

Tree canopy coverage by land type

Suburb
Street Coverage (%)
Public Coverage (%)
Residential Coverage (%)
The Basin
68.1
67.5
59.7
Canterbury
56.3
52.7
34.3
Warrandyte
55
85
48.7
Park Orchards
54.5
81.5
59
Warrandyte South
51.1
62.6
53.4
Wonga Park
49.1
86.7
44.9
Surrey Hills
48.1
57.2
33.9
Toorak
46.8
33.1
32
Sandringham
45
48.3
42.9
Elwood
44.3
18
24.4
1–10 of 258 rows
...

Total proportion of your suburb made up of streets

Suburb
Streets as a % of total area
South Melbourne
46
Middle Park
44.7
South Wharf
40.8
Princes Hill
39.4
St Kilda West
37.4
Carlton
36.7
Ripponlea
34.4
North Melbourne
34
Fitzroy North
31.9
Seddon
31.7
1–10 of 258 rows
...

There may be inaccuracies in the street coverage data when using Suburbs as a grouping unit, as not all Statistical Area 1s fit uniquely within a suburb.

SA1s are assigned to the suburb with which they have the highest overlap.


Next: Additional data & analysis